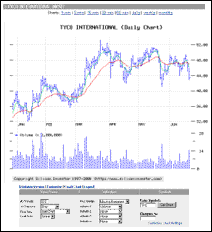

Zacks, Through the Zacks Aggregator Program,- the Marketing Arm for our Aggregator Partners, Offers you Technical Analysis Charts from Go2NET
Stock Charts
Stock charts create advantages for technical investors by helping them identify the underlying trend or pattern that is moving the price up or down. Being familiar with trendline formations can help measure an investors overall sentiments towards the stock and the company. Chart patterns illustrate recurring situations facing investors every trading day.
IQ Chart provides:

Charts include the ability to select:
- Number of ticks - 60, 120, or 180
- Price Tic Type - 1 min, 5 min, 15 min, 30 min, 60 min, daily, weekly, or monthly
- Chart Type - Bar Chart, OHLC Bar Chart, Candlestick Chart, or Line Chart
- Overlay - None, Moving averages, Bollinger Bands, or Linear Regression
- Up to four (4) indicators selectable individually from - None, Momentum, Stochastics, Volume, RSI, CCI, MACD, OBV, or DMI.
- Chart Scale - Linear or Logarithm. A link to a glossary of technical indicators explaining at least the indicators mentioned above is included. A delayed quote for the ticker plus symbol lookup links may also be displayed if required.
"Beyond the shadow of a doubt, IQ Chart is the best Java charting product available today!" PC Magazine 4/98
Briefing.com
|
COMTEX
|
Daily Sales
|
Edgar Online
|
Fly on the Wall
IPO.com
|
IQC Chart by Go2Net
|
JCF
|
Lipper Data Feed Service
| Price Targets
Sales Targets
|
siXer.com
|
Smart Money
|
Vickers
|
WVB
|
Xigo
|
Zacks
|
Zacks All-Star