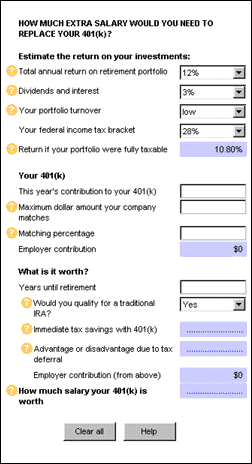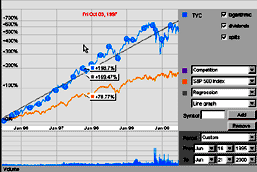

SmartMoney.com's state-of-the-art suite of over 50 online tools and worksheets offers some of the most innovative ways for individuals to view and understand complex data as well as develop a personalized financial plan. SmartMoney's worksheets and calculators can help users with all their personal finance needs.
 Worksheets
The basic categories covered include:
- Auto Center - Buying, selling and leasing
- Home Center - Buying, selling, refinancing and home improvement.
- Insurance Center - Tips for home, auto, life and disability insurance.
- College Center - Strategies for investing and paying for college.
- IRA Center - All the information needed to manage your IRA's.
- 401(k) Center - How to get the most out of your 401(k)
- Estate Planning - Worksheets and articles for every estate need.
- Divorce Planner - Financial planning and worksheets.
- Debt Management - Help for dealing with debt
- Tax Center - A full offering of articles and worksheets on just about every tax issue imaginable.
- Retirement Center - A comprehensive resource center to help users plan and reach their goals for retirement.
 Charting
Earnings
A bar graph presents the selected company's actual and estimated monthly earnings per share over the past three years.
A sliding scale ranks the selected company's estimated growth projections for current year, next year and next three- to five-year period compared against projected performance of the company's major competitors.
A table compares the company's earnings projections against its sector and the S&P 500.

 Ratings
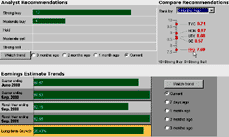
A graph shows how Wall Street analysts have rated the company's stock over a three-month period from Strong Buy to Strong Sell.
A sliding scale ranks analysts' recommendations on this stock against their recommendations on the stocks of major competitors.
Briefing.com
|
COMTEX
|
Daily Sales
|
Edgar Online
|
Fly on the Wall
IPO.com
|
IQC Chart by Go2Net
|
JCF
|
Lipper Data Feed Service
| Price Targets
Sales Targets
|
siXer.com
|
Smart Money
|
Vickers
|
WVB
|
Xigo
|
Zacks
|
Zacks All-Star